Quick Links
Behavior Support Levels (Tier 3)
Support Level by Date and Time
1. District level users with access to multiple campuses can select their campus using the drop-down menu.
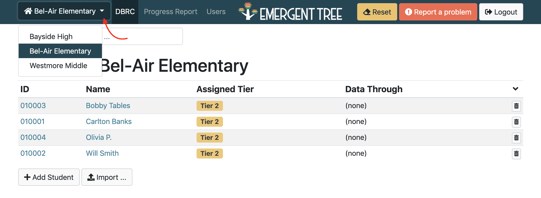
2. Campus users can select current students through the main page on the dashboard or using the drop-down menu.
For instructions on how to add a new user, select the link below:
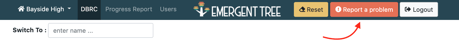
SUPPORT
Submit a request using the “Report a problem” feature.
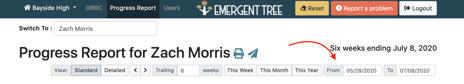
PROGRESS REPORTS
Select “Progress Reports” from the menu bar. Select time from for viewing progress report. Report defaults to six calendar weeks.
QUICK STATISTICS BAR
The quick statistics bar displays a summary of the data collected.
1. Select the "detailed view" when viewing a progress report.
When Fidelity Input is selected, the Quick Statistics provides information on fidelity of implementation and factors that would impact student progress, such as overall average, support levels and attendance.
School holidays are not calculated with student attendance. Those can be accurately reports on the DBRC data entry.
 2. Overall Average shows the overall average for the date range selected.
3. Independence shows the level of student independence from Staff Support Levels calculates the frequency of visual check or acknowledgement for the date range selected.
4. Attendance calculates the percentage of absences vs present. Holidays are not included in the calculation.
5. Daily Goal Attainment calculates frequency of total possible Daily Goal met for date range selected--Daily Goal established by student at check in, not overall goal from behavior scaled. Consistent implementation goal attainment will yield high percentage
6. DBRC Data Consistency calculates frequency of the total possible DBRC data intervals collected for the date range selected. Consistent implementation of DBRC data collected will yield a high percentage.
7. BSL Data Consistency calculates frequency of total possible BSL data intervals collected for the date range selected. Consistent implementation of BSL data collected will yield high percentage.
8. Feedback Loop Consistency calculates frequency of total possible Feedback Loop provided for the date range selected. Consistent implementation of Feedback Loop provided will yield high percentage.
9. Check-In/ Check-Out Consistency calculates the frequency of total possible Check-In and Check-Out provided for the date range selected. Consistent implementation of Check-In and Check-Out intervention provided will yield high percentage.
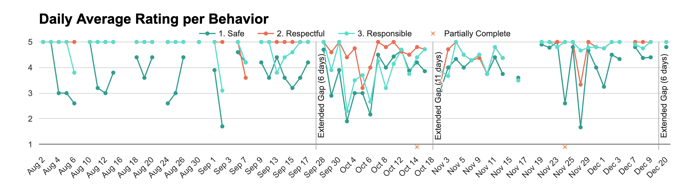
DAILY AVERAGE RATING
The daily average rating shows skill-acquisition over time using trend lines. Each behavior scale is indicated in a new color.
Note: Use the mouse to hoover over dates to see the daily average.
Absences are represented by a teal star. School Holidays and Extended Gaps (ie., summer break, winter break) are indicated by vertical lines. Dates with Partially Complete data are indicated with an orange star.
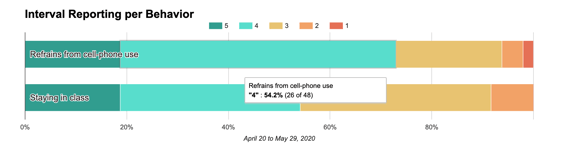
INTERVAL REPORTING
Interval reporting displays in a stacked column. Interval reporting shows the frequency/ percentage of each scaled behavior for the same time frame selected. Hover mouse to show exact percentage and intervals of behavior.
STAFF SUPPORT LEVELS (Tier 3)
STAFF Support Levels (tier 3) represent the level of staff support provided throughout the instructional day.
![]()
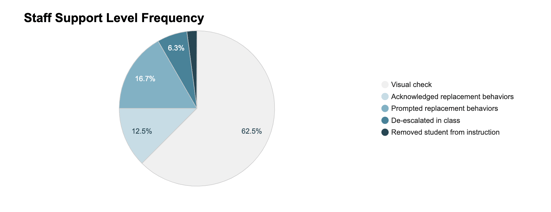
STAFF SUPPORT LEVEL FREQUENCY
Staff Support Level Frequency shows the percentage of type of support provided for the same time frame selected.
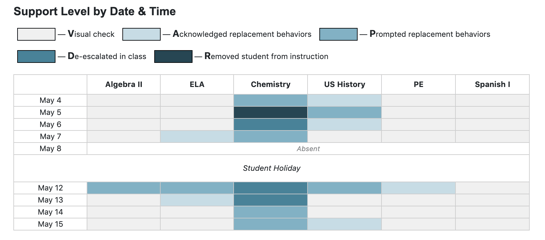
SUPPORT LEVEL BY DATE AND TIME
Support level by date and time show a scatter plot of the type of support provided for the same time frame selected.
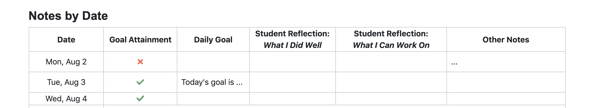
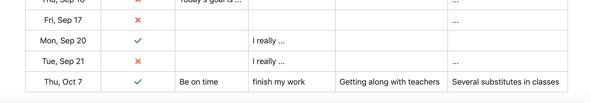
Notes by Date
Notes by Date show you the notes taken during a check-out for the date range selected.
I don't see any/all of my students on my dashboard...