Below is the administrator's view of a campus:
For more information on analyzing screener data, a training video can be accessed here.
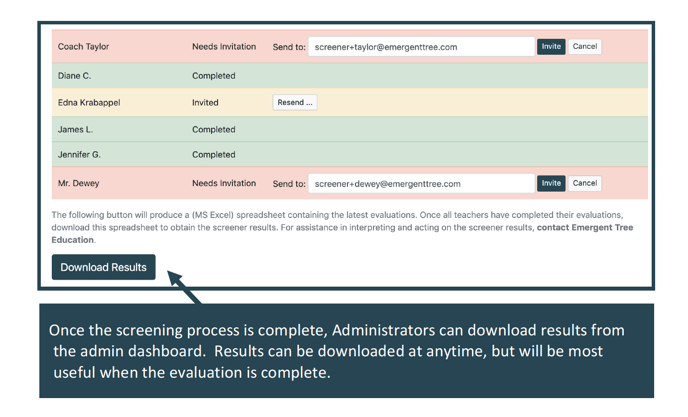
Administrators Download Results & Analyze
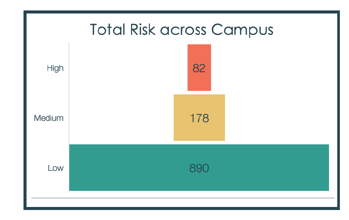
The OVERALL RESULTS graph displays students by at-risk levels. Campuses should aim to have no more than 15% of students flagged at medium-risk and no more than 5% of students flagged at high risk. When a tier is over-identified, then campuses should focus on fidelity of the tier below.
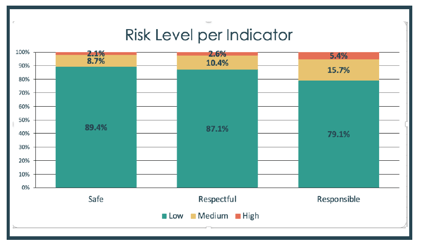
RISK LEVEL per INDICATOR divides campus data across school-wide expectations: Safe, Respectful and Responsible. Campuses can determine if specific expectations need further teaching or classroom acknowledgements or school-wide goal setting.
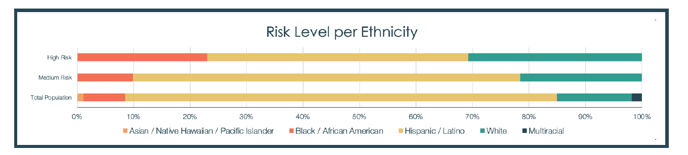
The RISK LEVEL per ETHNICITY graphs allows campuses to address over-representation in Tier 2 or Tier 3 behavior risk by ethnicity category. By comparing to total population, campuses can determine what areas are over-represented and determine next steps.
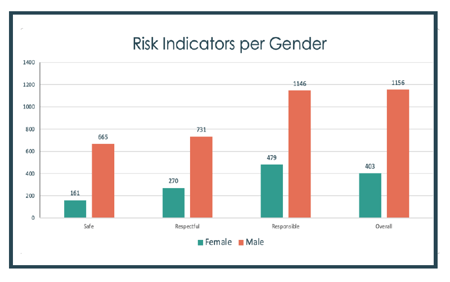
ELEVATED RISK per GENDER graphs allow campuses to look at risk levels across gender and school-wide expectation at the same time. After viewing this data, campuses might discuss how gender may affect teacher perceptions of student behavior or might, in some cases, effect student need.
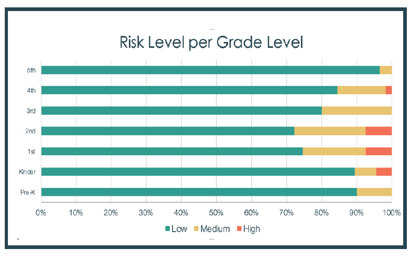
RISK LEVEL per GRADE graphs allow campuses to determine if specific grade levels needs further support. Grade levels with elevated risk might consider additional instruction on school-wide expectation, expanded teacher coaching, or boosting student acknowledgement processes.
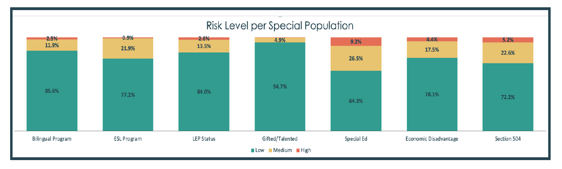
RISK LEVEL per SPECIAL POPULATION allow campuses to determine if certain student
groups are experiencing higher risk identification that the general population or other
special populations. Using this data, campuses may target students of certain special needs
for specific instruction, increase support or further interventions.